Energy Development and Poor Nations

About the panel

Scott Edward Anderson is a consultant, blogger, and media commentator who blogs at The Green Skeptic. More »

Christine Hertzog is a consultant, author, and a professional explainer focused on Smart Grid. More »

Elias Hinckley is a strategic advisor on energy finance and energy policy to investors, energy companies and governments More »

Gary Hunt Gary is an Executive-in-Residence at Deloitte Investments with extensive experience in the energy & utility industries. More »

Jesse Jenkins is a graduate student and researcher at MIT with expertise in energy technology, policy, and innovation. More »

Kelly Klima is a Research Scientist at the Department of Engineering and Public Policy of Carnegie Mellon University. More »

Jim Pierobon helps trade associations/NGOs, government agencies and companies communicate about cleaner energy solutions. More »

Geoffrey Styles is Managing Director of GSW Strategy Group, LLC and an award-winning blogger. More »

Read More

Utility Scale Solar Energy: North Carolina's Emergent Success

North Carolina Solar Development

By Lauren Shwisberg

North Carolina politics are always lively, sometimes infuriating, and often paradoxical. The North Carolina General Assembly has made the news several times this year for enacting some of the most controversial conservative policies in the country. Conversely, for the first time in 32 years, the southern state went blue in the 2008 presidential election. Yet, this state with a paralyzing partisan mix of liberal universities and stalwart conservatives, a burgeoning high tech industry and strong history of agriculture, has puzzlingly and quietly become one of the hotbeds of solar development in the United States. Even despite attempts from the right to repeal the state Renewable Portfolio Standard (RPS) this year, North Carolina ranked third in capacity of utility-scale solar in advanced development or under construction, as can be seen by the map below that was published by SNL Energy in mid-October.

north carolina

The ‘Perfect Storm’

No single factor has contributed to North Carolina’s success in attracting solar investment, but rather it has been a ‘perfect storm’ of adequate policy, responsive industry, and research and development expertise.

First, North Carolina has one of the oldest, most favorable renewable tax credits in the country. Enacted in 1977 to encourage solar water heating and cooling, the 35% tax credit, when combined with the 30% federal renewable tax credit can reduce residential and commercial investors’ initial project costs by about half.

However favorable the longstanding tax credit may be, North Carolina’s story of fast-paced solar proliferation really began with passage of the RPS in 2007 by the democratically held State Assembly; this was one of the first standards of its kind in the Southeast and was also in a state dominated by investor-owned utilities. North Carolina’s RPS is one of the least stringent in the country, requiring investor-owned utilities to provide 12.5% of electricity from renewable sources by 2021, but even this slight mandate has provided the semblance of market certainty that is necessary to attract significant investment.

In addition, North Carolina has additional assets that set it apart and have allowed it to realize the surprising spectacle exposed by the map above: a vibrant university environment, a large military presence, and a burgeoning high tech industry.

Universities and military installations have provided expertise and external funding for projects in the state. Using federal grants, North Carolina’s many universities have undertaken research and development to improve technology and implementation. Notably, North Carolina State University maintains a national database of state solar policies with funding from the Department of Energy. Likewise, military installations such as Camp Lejeune Marine Corps Base in eastern North Carolina have attracted Department of Defense funds for renewable projects, spurring investments in local solar companies and job creation.

North Carolina’s tech industry has also been rapidly developing, beginning in the Research Triangle area. Once called the ‘Silicon Valley of the Smart Grid,’ the Research Triangle is home to many companies conducting high-level renewables research, attracting federal and private investment. Even technology companies without a renewables focus are getting in the game: Apple constructed a 20 MW solar project at its datacenter in Maiden, and in conjunction with its plans to expand its Lenoir datacenter, Google is attempting to restructure the state utilities’ policies to make large solar purchase more accessible.

Limitations and Challenges

When examined closer, solar in North Carolina has some interesting and limiting quirks. For example, most of the utility-scale projects are relatively small. SNL Energy’s map, with a range of 1-60 MW for a small project, is deceptive. The bulk of North Carolina’s projects are actually under 5 MW, which Duke Energy, the majority investor-owned utility in the state, has designated as the cutoff for a standard rate option to sell back electricity. This cutoff is a result of a combination of complicated utility laws for projects above 5 MW and the reluctance of the investor-owned utilities to incorporate large projects into their grid before fully understanding the process and implications.

It is also worth noting something this map does not show, which is a large bias toward utility-scale customers in North Carolina. Residential customers are limited by two main factors: inflexible financing and a weak net-metering policy. In North Carolina, customers are required to own the source of renewable generation on their property, eliminating the possibility of the third-party finance and lease model that has been successful in states like California. Also, the utility takes ownership of all Renewable Energy Credits (RECs) generated from customers’ installations, removing a supplementary financial incentive that is appealing to both owners and external financiers. Finally, investor-owned utilities are the only ones in the state that currently net-meter, so those in localities with public utilities are out of luck.

Thus, the story of North Carolina’s success is far from complete. The state still must overcome substantial hurdles to future growth in the industry, including the expiration of the renewable energy tax credit in 2015 and an increasingly aggressive and antagonistic Republican majority in the General Assembly. However, with the vocalized support of Republican Governor Pat McCrory, it appears that many North Carolinians are starting to realize the potential of this promising industry to assist in their economic recovery. North Carolina should continue to build from its early achievements and foster a robust solar industry using the state’s unique advantages.

Read More

Oral Argument Hints that Supreme Court May Trim Back US Industrial Source Greenhouse Gas Regulations

Supreme Court and GHGs

On Monday, February 24, the Supreme Court heard oral argument in Utility Air Regulatory Group v. Environmental Protection Agency (EPA), in which petitioners challenged the EPA’s “Prevention of Significant Deterioration” (“PSD”) regulations for stationary industrial sources of greenhouse gases. These regulations, finalized in 2010, require sources that emit over 100,000 tons of greenhouse gases to obtain a PSD permit and adopt the “best available control technology” for every pollutant that they emit, including greenhouse gases.

The oral argument provided few surprises: it was as complex as expected in this case of arcane statutory interpretation. As described below, the argument did hint, however, that the Supreme Court might adopt a compromise position, holding that 1) industrial sources cannot be required to obtain a PSD permit purely on the basis of their greenhouse gas emissions, but 2) can be required to adopt best available control technology for their greenhouse gas emissions if they need a PSD permit anyway due to their emissions of other pollutants. This ruling would likely have little impact on EPA’s broader agenda on greenhouse gas emissions.

The argument follows from the Supreme Court’s landmark decision in Massachusetts v. EPA, a 2007 case in which the Supreme Court held that greenhouse gases were a pollutant under the general terminology of the U.S. Clean Air Act. Relying on this decision, EPA has adopted greenhouse gas standards for new cars and trucks. It has also proposed greenhouse gas standards for new coal and natural gas power plants. And it is due to propose standards for existing coal and gas plants at some point this summer. This case, however, concerns a separate set of standards, adopted under the Clean Air Act’s catch-all for industrial sources, the Prevention of Significant Deterioration requirement that requires state and local permitting agencies to ensure that new major sources adopt the “Best Available Control Technology.” Petitioners today made clear that they are not challenging EPA’s rules for cars, or its proposed rules for individual source categories such as power plants. Instead, they challenge only EPA’s PSD catch-all. 

EPA’s argument is simple: the Clean Air Act requires PSD regulation for sources of “any air pollutant” and Massachusetts v. EPA said that a greenhouse gas is a pollutant. Furthermore, the Clean Air Act language for PSD is the same as the language EPA used for the car rules and the power plant rules that petitioners are not disputing.

But there’s a catch. The Clean Air Act requires a PSD permit from any new source that emits over 250 tons of “any air pollutant.” That threshold makes sense for pollutants like lead and sulfur dioxide, but far too many sources emit that level of greenhouse gases, so EPA raised the level to 100,000 tons to avoid regulating hundreds of thousands of sources, which EPA acknowledges would be absurd.

Petitioners’ argue that, rather that re-write the statutory thresholds, EPA should not have included greenhouse gases in its PSD program. They say “any air pollutant” can mean different things in different parts of the act. It may be hard to imagine that Congress used the same word to mean different things in different places, but it’s even harder to imagine that Congress used the word “250″ to mean “100,000.”

That left three arguments at play in today’s arguments:

1) The government defended its entire regulation: sources that emit over 100,000 tons of greenhouse gases need a PSD permit, and a PSD permit requires the “best available control technology” for greenhouse gases.

2) Industry argued the opposite: emitting greenhouse gases cannot trigger a need for a PSD permit, and even if an industrial source needs a PSD permit because it emits other pollutants, it should not have to adopt “best available control technology” for greenhouse gases. That is, greenhouse gases are not included in the PSD program at all.

3) The Justices spent most of their time pressing both sides why they should not adopt some version of a compromise suggested by one petitioner and a dissenting circuit court judge: emitting greenhouse gases cannot trigger a PSD permit, but if a source needs a permit, it must adopt the best available control technology for greenhouse gases.

This compromise would not rely on altering the 250-ton threshold set by the statute. Justice Kennedy, the swing-vote, noted that the government had not cited any case that would allow that type of statutory re-write. At the same time, the compromise would force the biggest industrial facilities, which need a PSD permit anyway, to adopt best available control technology for greenhouse gases. Professor Jody Freeman, President Obama’s Counselor for Energy and Climate Change, recently suggested that perhaps EPA should have adopted this approach from the beginning to avoid the risk of Supreme Court reversal.

Both petitioners and the government tried to suggest that this fallback was inadequate. This was difficult for the petitioners, given that one of the petitioners had proposed that fallback. And Justice Kennedy, the presumed swing vote, emphasized that he was looking for an argument that followed “both the result and the reasoning” of Massachusetts v. EPA, which stressed the possible benefits of greenhouse gas regulation.

But the government also had a difficult time explaining why it could not accept the proposed compromise. Nearly all sources that emit 100,000 tons of greenhouse gases emit over 250 tons of some other pollutant, so they would require a PSD permit in any case. (And, under the compromise, this would mean they must adopt best available control technology for greenhouse gases.) The only sources that would be excluded, under the compromise, would be the few sources that emit threshold levels of greenhouse gases, but not any other pollutant. EPA estimated that its regulation would cover 86% of greenhouse gases emitted by facilities over the statutory threshold, whereas the compromise would cover 83%. Justices Ginsburg, Roberts, Breyer, and Sotomayor all mentioned this distinction, suggesting that there was very little difference between the government’s position and the proposed compromise.

On the other hand, Chief Justice Roberts, another potential swing-vote, noted that this compromise might require two definitions of “pollutant” within the statutory section on PSD: one definition for the kind of pollutant that triggers the need for a permit, and another definition for the kind of pollutant that must be controlled with the best available technology. Even if it is okay to have one definition for cars and another for PSD, it is somewhat troubling to have inconsistent definitions within the PSD program itself.

The government added a final wrinkle to the compromise suggestions. Justice Sotomayor, who seemed friendly to the government, asked the government if it must lose, how it would like to lose. (See pages 67-72 of the oral argument transcript.) In answer, Solicitor General Donald Verrilli, suggested that “pollutant” should still include all greenhouse gases except carbon dioxide, which is the most common greenhouse gas, and the reason that EPA changed the threshold. This is a particularly complex suggestion, and has already earned a critique from RFF’s Nathan Richardson.

In sum, oral argument suggests that there is some appetite for a compromise among the Supreme Court’s swing votes, and even among some of the government’s supporters. But, as usual, there are too many factors at play for a firm prediction. 

________________

Two disclaimers:

1) Before entering my academic career in 2011, I represented some of the petitioners in their challenge to EPA’s regulations.

2) I have omitted some details of the regulations and the petitioners’ arguments to avoid belaboring an already complex argument.

Photo Credit: Supreme Court and GHGs/shutterstock

Read More

Can You Make a Wind Turbine Without Fossil Fuels?

Wind Turbine and Energy Use

Various scenarios have been put forward showing that 100% renewable energy is achievable. Some of them even claim that we can move completely away from fossil fuels in only couple of decades. A world entirely without fossils might be desirable, but is it achievable?

The current feasibility of 100% renewable energy is easily tested by asking a simple question. Can you build a wind turbine without fossil fuels? If the machines that will deliver 100% renewable energy cannot be made without fossil fuels, then quite obviously we cannot get 100% renewable energy.

This is what a typical wind turbine looks like:

What is it made of? Lots of steel, concrete and advanced plastic. Material requirements of a modern wind turbine have been reviewed by the United States Geological Survey. On average 1 MW of wind capacity requires 103 tonnes of stainless steel, 402 tonnes of concrete, 6.8 tonnes of fiberglass, 3 tonnes of copper and 20 tonnes of cast iron. The elegant blades are made of fiberglass, the skyscraper sized tower of steel, and the base of concrete.

These requirements can be placed in context by considering how much we would need if we were to rapidly transition to 100% wind electricity over a 20 year period. Average global electricity demand is approximately 2.6 TW, therefore we need a total of around 10 TW of wind capacity to provide this electricity. So we would need about 50 million tonnes of steel, 200 million tonnes of concrete and 1.5 million tonnes of copper each year. These numbers sound high, but current global production of these materials is more than an order of magnitude higher than these requirements.

For the sake of brevity I will only consider whether this steel can be produced without fossil fuels, and whether the concrete can be made without the production of carbon dioxide. However I will note at the outset that the requirement for fiberglass means that a wind turbine cannot currently be made without the extraction of oil and natural gas, because fiberglass is without exception produced from petrochemicals.

Let's begin with steel. How do we make most of our steel globally?

There are two methods: recycle old steel, or make steel from iron ore. The vast majority of steel is made using the latter method for the simple reason that there is nowhere near enough old steel lying around to be re-melted to meet global demand.

Here then is a quick summary of how we make steel. First we take iron ore out of the ground, leaving a landscape looking like this:

This is done using powerful machines that need high energy density fuels, i.e. diesel:

And the machines that do all of this work are almost made entirely of steel:

After mining, the iron ore will need to be transported to a steel mill. If the iron ore comes from Australia or Brazil then it most likely will have to be put on a large bulk carrier and transported to another country.

What powers these ships? A diesel engine. And they are big:

Simple engineering realities mean that shipping requires high energy dense fuels, universally diesel. Because of wind and solar energy's intrinsic low power density putting solar panels, or perhaps a kite, on to one of these ships will not come close to meeting their energy requirements. We are likely stuck with diesel engines for generations.

We then convert this iron ore into steel. How is this done? There are only two widely used methods. The blast furnace or direct reduction routes, and these processes are fundamentally dependent on the provision of large amounts of coal or natural gas.

A modern blast furnace

The blast furnace route is used for the majority of steel production globally. Here coal is key. Iron ore is unusable, largely because it is mostly iron oxide. This must be purified by removing the oxygen, and we do this by reacting the iron ore with carbon monoxide produced using coke:

Fe2O3 + 3CO â†' 2Fe + 3CO2

Production of carbon dioxide therefore is not simply a result of the energy requirements of steel production, but of the chemical requirements of iron ore smelting.

This steel can then be used to produce the tower for a wind turbine, but as you can see, each major step of the production chain for what we call primary steel is dependent on fossil fuels.

By weight cement is the most widely used material globally. We now produce over 3.5 billion tonnes of the stuff each year, with the majority of it being produced and consumed in China. And one of the most important uses of cement is in concrete production.

Cement only makes up between 10 and 20% of concrete's mass, depending on the specific concrete. However from an embodied energy and emissions point of view it makes up more than 80%. So, if we want to make emissions-free concrete we really need to figure out how to make emissions-free cement.

We make cement in a cement kiln, using a kiln fuel such as coal, natural gas, or quite often used tires. Provision of heat in cement production is an obvious source of greenhouse gases, and providing this heat with low carbon sources will face multiple challenges.

A modern cement kiln

These challenges may or may not be overcome, but here is a more challenging one. Approximately 50% of emissions from cement production come not from energy provision, but from chemical reactions in its production.

The key chemical reaction in cement production is the conversion of calcium carbonate (limestone) into calcium oxide (lime). The removal of carbon from calcium carbonate inevitably leads to the emission of carbon dioxide:

CaCO3 â†' CaO + CO2

These chemical realities will make total de-carbonisation of cement production extremely difficult.

Total cement production currently represents about 5% of global carbon dioxide emissions, to go with the almost 7% from iron and steel production. Not loose change.

In conclusion we obviously cannot build wind turbines on a large scale without fossil fuels.

Now, none of this is to argue against wind turbines, it is simply arguing against over-promising what can be achieved. It also should be pointed out that we cannot build a nuclear power plant without concrete or steel is impossible. A future entirely without fossil fuels may be desirable, but currently it is not achievable. Expectations must be set accordingly.

Sustainable Materials With Both Eyes Open - Allwood and Cullen

Making the Modern World: Materials and Dematerialization - Vaclav Smil

Read More

Daniel Yergin: Looking Back and Forward at Big Trends in Energy

Full Spectrum: Energy Analysis and Commentary with Jesse Jenkins

Editor's Note: This article marks the launch of "Full Spectrum," a new column featuring the exclusive energy analysis and commentary of TheEnergyCollective.com's Jesse Jenkins. "Full Spectrum" will shed light on the key debates, hot new technologies, and important policy developments across the energy spectrum. Stay tuned...

Daniel Yergin at MIT Energy ConferencePulitzer prize-winning author and energy analyst Daniel Yergin kicked off the 2014 MIT Energy Conference Friday by looking back at big changes in the energy landscape since the conference launched in 2006â€"and ahead at three visions for the future of energy.

Dr. Yergin, Vice President of IHS and author of two bestselling books on the history of energy, The Prize: The Epic Quest for Oil, Money, and Power and The Quest: Energy, Security, and the Remaking of the Modern World, said much has changed over the last decade in the energy world.


From "Peak Oil" to Energy Abundance?

"It was the year of Peak Oil," Yergin said, looking back at 2005, when the MIT Energy Initiative was launched and the first MIT Energy Conference conceived. 

America and the world were concerned about rising global oil demand and stagnating production, with a growing consensus that global oil output was heading for a steady decline.

China had just joined the World Trade Organization in 2001 and was growing at a rate of 9 to 10 percent per year.

America and Europe had yet to enter the economic crises that disrupted their growth from 2008-2010.

Oil prices were rising fast, spiking above $60 per barrel for the first time (in nominal terms) in 2005 and on their way to north of $120 per barrel in 2008.

U.S. gasoline prices also shot up by more than a dollar per gallon to more than $3.00 as Hurricane Rita damaged Gulf Coast oil refineries and revealed the fragile margins between supply and demand.

US imported crude oil prices, 2000-2014

Figure: U.S. Imported Crude Oil Prices, 2000-2014. Source: US Energy Information Administration

In marked contrast, the debate in 2014 is about whether or not the United States should begin exports of newly abundant domestic natural gas and oil.

Unconventional oil and gas production based on hydraulic fracturing has upended discussions of peak oil and changed the energy landscape, Yergin said. 

"Since 2005, U.S. oil production is up 3 million barrels per day. To put that in perspective," Yergin told the audience at MIT, "that's more than the output of 9 of 12 OPEC nations." 

U.S. Field Production of Crude Oil, 2000-2012
Figure: U.S. Field Production of Crude Oil, 2000-2012. Source: US Energy Information Administration

The shale gas "revolution" has given North America new supplies of low-cost natural gas, which is shifting the balance of manufacturing competitiveness in America's favor, Yergin noted.

While cheaper natural gas is giving a boost to U.S. manufacturers, Yergin says European countries are increasingly worried about a new wave of "de-industrialization" due to globally uncompetitive energy prices.

Meanwhile, liquefied natural gas terminals originally intended to import gas in 2005 are now planning to be export terminals, with half a dozen projects winning approval from the Department of Energy as of February.


Rise of Renewables and the Globalization of Energy Demand

If unconventional oil and gas are one big game changer in the energy landscape over the last decade, the other is the rise of non-hydro renewable energy sources like wind and solar energy.

In the year 2000, only about $5 billion was invested in renewable electricity technologies, Yergin said. By 2012, renewable energy investments surpassed $240 billion. Wind and solar are now mature and fast-growing industries.

By 2012, global wind energy capacity stood at 283 gigawatts, a more than 16-fold increase from 2000, while solar had grown more than 70-fold to over 100 gigawatts globally.

Global wind energy capacity 1996â€

Figure: Global Wind Energy Capacity, 1996-2012. Source: REN21 "Renewables 2013 Global Status Report"

Global solar PV capacity 1995â€

Figure: Global Solar PV Capacity, 1995-2012. Source: REN21 "Renewables 2013 Global Status Report"

Still, energy transitions take time, and Yergin's IHS team projects that even at a robust 7 percent annual compound growth rate, renewable electricity sources (excluding hydroelectric power) will grow to only 15 percent of the global electricity share in 2035.

Part of the challenge is that global electricity demand is rising nearly as fast as renewables, as energy demand becomes more global.

While energy demand is fairly flat in developed economies, like the United States and European Union, energy needs are rising fast in the world's emerging economies.

Emerging economies will account for more than 90 percent of global energy demand growth over the next two decades. By 2035, today's developed nations will account for less than half of global energy use, according to the International Energy Agency.

Global Energy Demand Projections 2035

Figure: Projected Primary Energy Demand Growth in Key Regions. Source: International Energy Agency "World Energy Outlook 2013" 

That means that despite growing production, global oil prices have persisted at about $100 per barrel, and we look back today at all that consternation over $60 per barrel oil and $3 per gallon gas in 2005 with fondness.

Rising demand in the emerging economies has another impact. While wind and solar growth was concentrated in OECD nations over the last decade, going forward, Yergin sees renewable energy finding a larger foothold in these emerging economies as well.

Just look at China, where the nation's over-reliance on coal and the resulting air pollution problems choking major cities like Beijing and Shanghai is motivating major investment in cleaner energy sources.

While China is still the world leader in coal consumption, they have simultaneously become the world's largest market for wind, solar, and nuclear energy as well

Other emerging economies from India and Africa to South America are also beginning to adopt renewable energy, and Yergin sees these trends accelerating going forward.

Renewable Energy Capacity Growth By Region

Figure: Projected Annual Renewable Energy Capacity Growth by Region, 2012-2018. Source: International Energy Agency "Medium-Term Renewable Energy Market Report 2013"


Three Visions for the Future of Energy

Yergin closed his remarks at the MIT Energy Conference by describing three scenarios for the future of the global energy landscape. These three visions, created by IHS, sketch markedly different paths for the evolution of the energy sector over the next two decades.

The first vision, which Yergin called "Global Redesign," sees the continuation of the unconventional oil and gas and renewable energy trends described above. This becomes an "all of the above" energy future, where the unconventional oil and gas booms go global, as do renewable electricity and biofuels. Electric vehicles remain fairly niche in this world, and coal's share of the global energy mix declines modestly.

The "Meta" scenario envisions a series of climate change-related disastersâ€"major droughts, floods, or hurricanesâ€"and rising oil prices motivate a more rapid increase in the global use of renewables and new nuclear reactors, including small modular reactors, as well as a push to electrify transportation with plug-in electric vehicles.

Finally, a future of global economic insecurity leads to the "Vortex" scenario, where energy security and affordability become the chief priority, leading to a greater reliance on coal and stagnation of renewable energy growth.

In the end, "you vote for the energy future you want to see with your work, your passions, and your career," says Dr. Yergin.

Which energy future are you working to make a reality?

Read More

Don’t Hold Your Breath for Any Progress Stemming from the Joint Statement by NRDC and EEI

EEI NRDC Joint Statement

In their widely heralded “joint statement” last week, the Edison Electric Institute (EEI) and the Natural Resources Defense Council (NRDC) articulated a “path-breaking” agreement to enable more efficiency and clean energy from utilities. At first blush it seemed to reflect an emerging understanding of the need to sustain energy utilities while enabling more efficiency initiatives and customer-owned distribution in ways that can improve the environment.

But beyond the EEI’s press release and NRDC’s optimism, the reality is their statement is a muted effort to help states advance their regulations with each of their priorities front of mind. It was hardly a call-to-action some are describing it as. 

Since I wrote about this last week and raised several similar issues the statement seems designed to address,  let’s parse the words of the joint statement to see what, if anything, will likely come from this pact.

If you haven’t yet, you can find the joint statement here; you can also find  comments by the NRDC’s Ralph Cavanagh here and EEI’s press release here.  

First, we all have to realize that real progress only can be made only by state utility commissions, many of which seemed unwilling to seriously consider moving beyond regulatory compacts in states that for decades have rewarded utilities only, or mostly, for selling more kilowatt hours.  Now that electricity demand nationally is flattening and may be declining, the time has come for tradition-bound states to re-engineer the traditional regulatory compact.

Here are some questions to help determine if the thrust of the recommendations in the joint statement will bear fruit:

From recommendation #1: “utility businesses should focus on meeting customers’ energy service needs” and “should not focus on levels of retail commodity sales.”As perhaps the most over-arching principle in the joint statement, this will be the toughest nut to crack. In remarks to yours truly, Cavanagh was quick to cite his “repeated unwillingness to deliver some kind of ‘mission accomplished’ message.”

From recommendations #2: commissions “should provide for reasonable and predictable annual adjustments in utilities’ authorized non-fuel revenue requirements.” I agree. But watch closely for how regulators define “reasonable”. We’re talking about fixed charges needed to improve and protect the grid and enable smart meters; but those charges should stop there and not penalize ratepayers who choose to generate some of their own electricity. There could be several ‘devils’ lurking in those details.

From recommendation(s) #3: “ . . .operators of on-site distributed generation must provide reasonable cost-based compensation for the utility services they use while being compensated fairly for the services they provide.” Here we go again, what’s reasonable? And what does the latter half of that statement mean for net metering, which wasn’t mentioned anywhere? Compensated at the retail rate? At wholesale?

“Customers deserve the opportunity to interconnect distributed generation to the grid quickly and easily.” There are numerous hurdles some solar power users have to climb through to make their rooftop solar systems function in sync with the electricity they still need from the utility. Because solar panels generate electricity when it’s needed most on very hot days and even some very cold days, the permitting rules and other requirements  should be removed or least streamlined.

From recommendation(s) #4: “Utilities deserve assurances that recovery of their authorized non-fuel costs will not vary with fluctuations in electricity use.”  I could not agree more, provided those costs are truly reasonable and don’t effectively penalize solar rooftop owners. I think you can see a common thread emerging from these recommendations that call for decoupling utility profits from electricity sales.

“Customers deserve assurances that costs will not be shifted unreasonably to them from other customers.” Careful here. One of the quickest rebuttals to enabling rooftop solar is that utilities will incur new costs that non-solar customers shouldn’t have to pay for. I’ve yet to see any credible accounting of that.  If anything, there may very be a measurable net benefit to society from rooftop solar from reduced emissions and stress on the grid, especially during times of peak demand.  Will utilities and regulators consider that in a rulemaking? It should work both ways. I addressed the value of solar in a column last month here.

Recommendation #5: “. . . consider expanding investor-owned utilities’ earnings opportunities to include performance based incentives tied to benefits delivered to their customers”  . . . that “improve energy efficiency, integrate energy generation and improve grids.”  Yes to all the implications this statement implies, although â€" again - it leaves much to interpretation. Most important, let’s provide incentives for utilities to make more money for their shareholders IF they deliver the services that their regional economies need and which contribute to cleaner air and water that are now possible with technological advances. Let’s authorize higher rates reflecting these priorities.

The other three recommendations seem to hit on these aforementioned priorities so I’ll stop there.

Of the 34 states (according to Cavanagh) that have yet to decouple utility profits from electricity sales, here’s a short list of states whose investor-owned utilities have the most work to do. We’re talking about â€" in alphabetical order â€" Alabama, Florida, Kansas, Kentucky, Mississippi, Missouri, South Carolina, Virginia and West Virginia.

In my column last week I showcased how the Washington (state) Transportation and Utilities Commission worked with Puget Sound Energy and several stakeholders to forge a responsible path forward with decoupling. Here, I’ll explore a state known my many to be a laggard when it comes to forward-thinking energy policy â€" Virginia â€" and how it treats its largest electric utility, Dominion Virginia Power.

Virginia is interesting not only for its refusal to decouple electricity rates but because the state has decoupled profits from sales by natural gas utilities. Why one and not the other?

https://www.scc.virginia.gov/pix/group.jpg
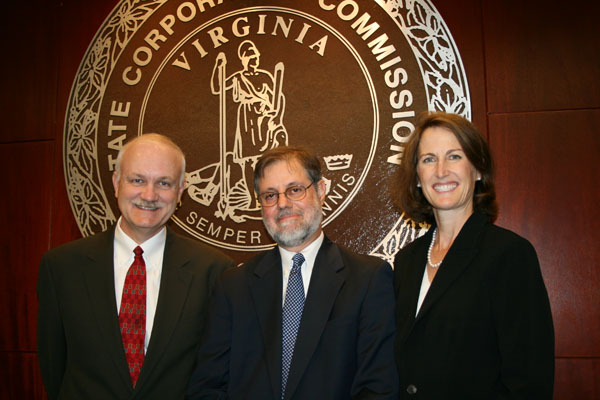
Virginia's State Corporation Commission consists of, from left, Mark C. Christie, James C. Dimitri and Judith Williams Jagdmann.

To cite a recurring theme among efficiency and clean energy advocates who live mostly in the Northern Virginia suburbs of Washington, DC, in some college towns and / or in the Newport News / Norfolk region where the Chesapeake Bay meets the Atlantic Ocean, many ratepayers feel as though Dominion Virginia Power is seriously lagging in innovation, smarter grids and cleaner energy options sprouting in many states.  Some surveys in these areas signal a willingness to pay more for electricity IF the utilities do more to sustain the environment and enable them to control their usage.

The body regulating electricity in Virginia is the State Corporation Commission. It has three members, serving staggered 3-year terms. They are put there by a joint vote of the state House of Delegates and state Senate. Because each chamber has been controlled by Republicans and previous governors overwhelming have been conservative, if not mostly Republicans, regulations are consistently interpreted as favoring Dominion Virginia Power: profits rise if sales increase, plain and simple.

Dominion Virginia Power’s headquarters sit barely a mile away from the Commission in downtown Richmond. Executives sometimes serve on the transition committees for incoming Republican governors.  While that did not occur after Democrat Terry McAuliffe won the Governor’s mansion last November and Democrats secured a tie-breaking majority in the Senate, the commission is not expected to change its fundamental course, even if one or more of the commissioners move on.

A well-respected Republican member of the Republican-controlled House of Delegates who has been on the receiving end of many appeals from Dominion Virginia Power lobbyists during the current and previous General Assemblies, chose his words carefully in asserting the utility and the commission have a “cozy relationship.”

Will the EEI-NRDC joint statement change lead to changes in Virginia and these other lagging states?  Two attempts for inputs from a Dominion Virginia Power executive yielded nothing by late last week.

So stay tuned. But I wouldn’t hold my breath.

Read More

Ivanpah Solar Thermal Officially Opens

ivanpah solar array

BrightSource Energy’s 377 MWe (net at peak) Ivanpah solar thermal power station officially opened on February 13, 2014. Secretary Earnest Moniz, in a rather amusing turn of phrase, called the plant a “shining example of how the United States is becoming a world leader in solar energy.” With more than 340,000 computer controlled mirrors spread over 3,500 acres of desert land focusing reflected sunlight onto three 459 foot tall towers, there is no doubt that the plant will shine brightly. As the DOE blog described it, Ivanpah is a “photogenic facility”.

With an expected capacity factor of 32% the plant should produce about a billion kilowatt-hours per year. According to most sources, the plant cost $2.2 billion, about $1.6 billion of which was financed with a loan guarantee from the Department of Energy. Though that financial support is mentioned frequently, the project received several additional incentives that made it an attractive investment.

Since Ivanpah is a solar energy project and not a nuclear project, it was eligible for DOE loan guarantees under section 1705 as opposed to the section 1703. That means the government appropriated funds for the Credit Subsidy Cost, which is the fee that is supposed to reimburse the federal government for the risk associated with providing the loan guarantee.

In contrast, when Constellation Energy was offered a loan guarantee for the Calvert Cliff unit 2 nuclear project under the same 2005 Energy Policy Act program that provided Ivanpah’s funding, the Office of Management and Budget (OMB) calculated a fee of $880 million for a $7.5 billion loan.

Since it began operation before 2016, Ivanpah was eligible for the 30% Investment Tax Credit in Lieu of Production Tax Credits that was initially devised as part of the American Recovery and Reinvestment Act (ARRA) and applied to solar thermal with subsequent legislation, so the developers will receive a refund of $660 million within the next 18 months.

Since Ivanpah is a solar thermal power system that began operating before the end of 2013, it qualifies for Modified Accelerated Cost-Recovery System (MACRS) + Bonus Depreciation (2008-2013). The value of that treatment varied depending on the profitability of the company taking the deduction, but there is an active market that enables even loss making companies like BrightSource to benefit from the favorable depreciation schedules.

The project also benefits from California’s renewables portfolio standard that mandates that utilities operating in the state purchase at least 33% of their power by 2020 from qualifying renewable energy sources. The Wall Street Journal reports that utilities have signed 25 year power purchase agreements to buy the power from Ivanpah, but neither the utilities nor the state utility regulator has disclosed the price that the utilities will pay. They have only stated that the costs will be rolled into the bundled rate paid by electricity customers.

If you are interested in a complete list of the incentives that made it possible for the Ivanpah developers to attract the “private” capital that Robert F. Kennedy, Jr. has often described as being very interested in solar energy development, I highly recommend reading the Risk Factors section of BrightSource’s S-1 filing for their aborted initial public offering.

As Kennedy described, the power purchase agreement encouraged by the renewable portfolio standard was one of the clinchers that made the deal attractive to his investment company.

Unlike Solyndra which received corporate financing from DOE, and which had no assurance that it would be able to sell its product, Ivanpah and the Central Valley Solar Ranch projects have contractual commitments from California’s largest utilities to buy all of its power at fixed prices. This is comparable to building a new hotel with the guarantee that it will have 100% occupancy rates for 20+ years.

There has been quite a bit of commentary in sources like KCET Rewire about the effect that the operation of the system is having on birds. As one might imagine, flying over a 4,000 acre field of shining mirrors that are focusing solar energy to specific points more than 450 feet above the ground might be a hazardous endeavor. Apparently air temperatures near the boilers can reach 1,000 F. Solar energy may be natural and renewable, but it is not necessarily safe in concentrated form.

The site’s construction was also delayed when the builders discovered that there were more desert tortoises on the site than initially expected.

It will be interesting to follow the performance of this project over time. There are a large number of moving parts â€" at least 340,000 of them keeping the mirrors aimed at the boilers â€" and all of the normal pumps, valves, pipes, and chemistry associated with operating high pressure steam systems. It will be wonderful if the system operates reliably, but I suspect that there will be more than a few unscheduled maintenance shutdowns that reduce the achieved capacity factor to something substantially less than the claimed 32%.

Does anyone know if there will be any publicly accessible performance reports submitted?

The post Ivanpah Solar Thermal officially opens appeared first on Atomic Insights.

Photo Credit: Large Solar Energy Projects/shutterstock

Authored by:

Rod Adams

Rod Adams gained his nuclear knowledge as a submarine engineer officer and as the founder of a company that tried to develop a market for small, modular reactors from 1993-1999. He began publishing Atomic Insights in 1995 and began producing The Atomic Show Podcast in March 2006. Following his Navy career and a three year stint with a commerical nuclear power plant design firm, he began ...

See complete profile

Read More

Ivanpah: World's Biggest Solar Energy Tower Project Goes Online

Yesterday was the celebration of full operation at the 392-megawatt Ivanpah Solar Electric Generating System, the world’s biggest concentrating solar power tower project. The celebration was attended by technology originator BrightSource Energy (BSE), owner NRG Energy, builder Bechtel, and major equity investor Google.

The application for the project was filed in 2007 and was “just a bold idea," said Google’s Rick Needham.

DOE Secretary Ernest Moniz was at the celebration and he noted, “Four of the world’s five biggest CSP projects and the first five U.S. utility scale PV projects were supported by DOE loan guarantees," adding, “As a result, none of the next ten utility scale solar installations required federal support.”

In the face of California’s severe drought, Moniz added, Ivanpah’s dry-cooling technology allows a “parsimonious use of water.”

For Bechtel’s 2,700 employees, Division President Toby Seay said, assembling Ivanpah’s 173,000 heliostats and constructing its three 460-foot tall towers became “this generation’s legacy, its Hoover Dam, its testament to U.S. ingenuity.”

Ivanpah’s integration into California’s grid, BSE Chair/CEO David Ramm said, was performed in planned stages and without unexpected events.

What they did not mention was the giant tent-like facility made from construction materials developed for Iraq that was built at Ivanpah to assemble heliostats. Designed to turn out 500 per day, it turned out 650 twinned, garage-door sized mirrors per day at the height of Ivanpah’s construction.

It is no longer in operation.

The plan was to use the facility to assemble heliostats for the next solar power tower project. But there are no more such projects permitted. NRG plans to use it as a warehouse.

The short term outlook for CSP is a “mixed bag,” reported GTM Research Solar Analyst Cory Honeyman. Two gigawatts of projects with longstanding PPAs are finally coming online, starting with Abengoa's Solana Generating Station and the first phase of NextEra's Genesis solar project. “But the dry spell in new procurement means that installation growth we see over the next two years is rooted in a static pipeline that has been more or less the same since the end of 2012.”

Why?

One factor is that, as NRG Energy President Tom Doyle noted, the participation of off-takers Southern California Edison and Pacific Gas & Electric was key. But they and other California utilities have met their near-term renewable energy mandates and are not handing out the power purchase agreements that bring in equity investors like Google.

Demand has shifted to smaller sized projects that can be rapidly deployed in order to meet near term capacity needs, explained Honeyman. “Developers are now bidding into dwindling utility procurement programs at aggressive price points with thin margins that make it increasingly difficult to secure financing.” 

But California and other Southwestern desert states will up their renewables mandates, argued BSE spokesperson Joe Desmond. “Governor Brown said California’s 33 percent mandate is a floor, not a ceiling.”

Another factor is the until-now unproven CSP technology. “Our challenge was to build Ivanpah to demonstrate the technology works at commercial scale,” said Ramm. Investors and policy makers in the U.S. and around the world have been awaiting that proof before committing to it.

A third and crucial factor is the high cost of CSP. Though Ivanpah’s PPA prices are undisclosed, they are thought to be no less than the $0.135 per kilowatt-hour PPA price for SolarReserve’s 110 megawatt Crescent Dunes project in Nevada, far from DOE’s CSP target price of $0.06 per kilowatt-hour.

Through economies of scale, costs can be cut 30 percent to 40 percent, BSE’s Ramm said. BrightSource has said the costs for building Ivanpah’s third tower were significantly lower than for the first.

Between 1981 and 1991, public support allowed developers to build nine parabolic trough projects, CSP Alliance President Tex Wilkins recently recalled. “The first Solar Energy Generating Station (SEGS) cost about $0.24 per kilowatt-hour but the ninth SEGS came in at about $0.12 per kilowatt-hour.”

Both wind and PV were expensive until public support drove market growth and CSP’s price could come down to $0.09 per kilowatt-hour, Wilkins said. “But not until more projects are built.”

Even at $0.09 per kilowatt-hour, CSP will find it difficult to compete in a market place dominated by the still falling PV price and cheap natural gas. One of the keys to getting the cost down and attracting more utility interest will be adding storage capability, Ramm said, and BSE will incorporate molten salt storage into its next project.

The bird-kill sensationalism headlined in a Wall Street Journal is a non-issue, said NRG President David Crane. Only 44 birds were killed by solar radiation at Ivanpah since the project went online in December, he said. Millions are regularly killed by things like urban skyscrapers and house cats. And NRG is involved in intense efforts, in conjunction with state and federal environmental and regulatory agencies, “to take that 44 to 0.”

“The public is convinced there are only a handful of ways to get energy,” said Isaac Slade, lead singer for Grammy winning rock group The Fray, which shot its most recent video at Ivanpah. “But those old school ways do lasting damage and my generation is hip to that.”

 greentech mediaGreentech Media (GTM) produces industry-leading news, research, and conferences in the business-to-business greentech market. Our coverage areas include solar, smart grid, energy efficiency, wind, and other non-incumbent energy markets. For more information, visit: greentechmedia.com , follow us on twitter: @greentechmedia, or like us on Facebook: facebook.com/greentechmedia.

Authored by:

Herman Trabish

Herman K. Trabish, D.C., was a Doctor of Chiropractic in private practice for two decades but finally realized his strategy to fix the planet one person at a time was moving too slowly. An accidental encounter with Daniel Yergin's The Prize led to a protracted study of the bloody, fiery history of oil and then to Trabish's Oil In Their Blood "trilogy" (http://www.oilintheirblood.com), a pair ...

See complete profile

Read More

Do Methane Leaks Negate Climate Benefits of Natural Gas? Four Takeaways From a New Science Study

A new analysis published in Science today ($ub. required) concludes that more methane is leaking from natural gas wells and pipelines than the federal government has estimated, eroding some of the climate benefits of the cleaner-burning fuel.

The sixteen researchers â€" from Stanford, the National Renewable Energy Laboratory, University of Michigan, MIT and elsewhere â€" reviewed more than 200 studies estimating how much methane, a potent greenhouse gas, escapes into the atmosphere. The panel concludes that actual methane emissions are 25 to 75 percent higher than the estimates published by the Environmental Protection Agency's national Inventory of Greenhouse Gas Emissions and Sinks. 

That said, the ability of natural gas to help reduce emissions of the greenhouse gases (GHGs) responsible for climate change hinges on the sector in which it used: the ongoing shift from coal to natural gas in the electric power sector continues to have "robust climate benefits" the authors conclude, while using natural gas as a transportation fuel in place of diesel or gasoline is more suspect.

With those mixed findings, the report is sure to add fuel to both sides of the debate over the net benefits of America's growing reliance on natural gas, which has been touted as either a "bridge fuel" towards a lower-carbon energy system or the next big environmental scourge.

Let's dig into four big takeaways from the new Science study.

1. Methane leaks are worse than EPA estimates, but fracking isn't the main culprit

The study surveys 20 years of research on methane emissions from the nation's energy infrastructure and concludes that bottoms-up inventories of the kind employed by the EPA routinely undercount emissions rates.

That's a big deal, because "methane as a molecule is a very potent greenhouse gas â€" about 30 times more potent than carbon dioxide on a 100-year basis, and much more so over a shorter-term basis," explains Francis O'Sullivan of the MIT Energy Initiative, one of the study's authors.

As a result,"even small leaks can have a very significant impact on climate change," O'Sullivan says. 

The EPA's inventories are constructed by sampling emissions rates at a small subset of equipment used to produce or transport natural gas, oil, or coal, and then scaling up those samples to derive an estimate for the nation's full energy infrastructure. As a result, these inventories produce estimates with a wide uncertainty range, which has been well known.

The new study concludes that there are at least four reasons to believe EPA's estimate consistently undercount methane emissions as well:

  • First, the sampled devices are often older and not representative of modern techniques used in the energy sector, including hydraulic fracturing and horizontal drilling, which were not widely employed during much of the sampling period used to estimate the EPA emissions factors.
  • Second, collecting samples is expensive and tends to be provided by "self-selecting cooperating facilities," which means the sample size is small and populated by estimates volunteered by precisely those firms most likely to have strong environmental practices in place.
  • Third, there is considerable evidence that overall methane emissions are driven by a few "super-emitters" (more on that later), in which case sample methods assuming a normal bell-curved distribution of emissions rates won't capture the "heavy tails" really at play.
  • Fourth, the quality of the data and device counts used to construct the nation-wide estimates are incomplete and "of unknown represenativeness" as well.

Based on a survey of national-scale atmospheric measurements of methane levels, the study concludes that total emissions are actually 1.25 to 1.75 times higher than the EPA's bottoms-up inventory reports.

The author's best guess: U.S. methane emissions are 50 percent higher than the EPA's estimates.

So is fracking to blame for the excess emissions? Actually, no.

"[H]ydraulic fracturing for [natural gas] is unlikely to be a dominant contributor to total emissions," the study states. 

The recent rise of hydraulic fracturing, or "fracking," is likely responsible for only about 7 percent of the excess methane, the authors estimate. 

"This is a lot of methane â€" it’s not trivial," says Stanford's Adam Brandt, the study's lead author. "But this doesn’t appear to be the main contributor. The math just doesn’t work out."

Excess emissions are more likely coming from a broad range of activities across the oil and gas sectors, as the following figure illustrates.

Methane Leaks from U.S. Oil and Gas Infrastructure

Fig. Methane Leaks from U.S. Oil and Gas Infrastructure 
EPA estimate in blue, literature estimates in red with central estimate and uncertainty ranges. Source

2. Switching from coal to natural gas for electricity generation still offers "robust" climate benefits

Despite higher estimates of fugutive methane emissions from across the natural gas system, switching from coal to gas in power plants is still a net boon for the climate, the study finds.

"Although our study found natural gas leaks more methane than previously thought, the shift to natural gas is still a positive move for climate-change-mitigation efforts," says MIT's O'Sullivan. 

Burning natural gas to produce electricity produces 40 to 60 percent less CO2 than a coal-fired power plant, and an historic shift from coal to gas in the electric power sector has helped drive down U.S. energy-related CO2 emissions to their lowest levels since 1994.

But emissions at the smoke stack are only half the story, and any methane emissions upstream undermine the net benefits of switching from coal to gas.

Still, replacing EPA's estimates with the higher range of methane emissions estimates from the study "still supports robust climate benefits from [natural gas] substitution for coal in the power sector over the typical 100-year assessment period," the authors write in Science.

3. Using natural gas as a transportation fuel may not hold any climate benefits.

While using gas in the power sector can help cut total U.S. greenhouse gas emissions, running our cars, trucks, and buses on natural gas may not help climate matters much, the study finds.

"Substituting natural gas for gasoline appears to yield no appreciable climate benefits," says O'Sullivan. "In the case of diesel fuel, switching to natural gas would actually be a negative change for climate efforts."

That's because using compressed natural gas (CNG) to fuel our vehicles produces only 30 percent less CO2 than burning diesel. With a narrower CO2 benefit to begin with, the study's higher estimates for methane leaks would more than offset the net climate benefits of CNG-fueled buses and trucks.

It's worth noting that all those CNG-fueled buses and dump trucks running around American cities do deliver real improvements in air quality over their diesel-fueled brethren. Those health benefits have been the real motive behind the shift to buses and other urban heavy-duty fleets running on "clean burning natural gas."

Still, the climate implications of this study are an important finding, as the nation considers an even greater reliance on natural gas as a substitute for oil in the transportation sector.

In his 2014 State of the Union address, President Obama declared his support for "building fueling stations that shift more cars and trucks from foreign oil to American natural gas."

Yet whatever the benefits for air quality or energy secutiry, "that’s not a good policy from a climate perspective" said Stanford's Brandt.

4. A few "super-emitters" are responsible for the bulk of methane leaks, pointing the way to reducing climate impacts

While the study paints a darker picture of the net climate impacts of natural gas, "opportunities abound" to reduce methane leaks and improve that picture, the authors write.

Better regulations could improve reporting requirements and clamp down on methane leaks â€" often just by requiring techniques that are already profitable but not uniformly adopted across the industry. That includes reduced emissions completions of oil and gas wells, also known as "green completions." The EPA was set to require green completions at all hydraulically fractured natural gas wells, but delayed implementation of the rule until 2015.

"This report justifies EPA taking action on regulation of methane pollution and to focus that regulation on existing wells," said Mark Brownstein, chief counsel for the American climate and energy program at the Environmental Defense Fund.

The other major opportunity comes in finding better ways to identify, and halt, a few large emitters, which the study finds are responsible for a disproportionate amount of methane emissions.

For example, one study surveyed measured emissions rates at about 75,000 components and found that more than half (58 percent) of overall emissions came from 0.06 percent of possible sources.

Or in Science-speak: "The heavy-tailed distribution of observed emissions rates presents an opportunity for large mitigation benefits if scientists and engineers can develop reliable (possibly remote) methods to rapidly identify and fix the small fraction of high-emitting sources."

Eliminating methane leaks from these "super-emitters" will be key to unlocking the potential climate benefits of natural gas.

Read More

The Importance of Innovation to the Nuclear Industry

A comment caught my attention at a recent nuclear industry event.  The comment was that a hi-profile agency with a mandate to do research in advanced technology across industries had no interest in attending any events to learn more about nuclear power â€" primarily because “nuclear is not innovative”.  In reality, there are numerous examples of how the nuclear industry has and continues to improve through innovation. 

In exploring this comment, what we found was a belief (likely more prevalent than we would like) that renewables like wind and solar as well as various storage technologies are moving forward, innovating to become the energy source of the future, while old technologies like nuclear are past their prime heading into old age.

The discussion then moved to future reactor designs as proof of innovation in the nuclear industry.  Look at fast reactors, thorium reactors or even SMRs.  Although these are all interesting, it was pointed out that these represent “novelty”, not innovation.  And to argue that a novel design is what is required to save the industry (although they will come) gives the message that today’s designs are just not good enough â€" and that is absolutely not true.

The public looks at nuclear power and sees a staid industry, some think in decline, that is building technology that has been around for 50 years.  Granted some nuclear projects continue to be built above budget and over schedule, while other “newer” technologies continue to improve and reduce cost and schedule â€" as would be expected when developing technologies of the future.

However, there are numerous examples of innovations across the nuclear industry.  For example, China has made improvements to the Daya Bay CPR1000 design at Lingao.  They increased the output by about 100 MW through an improved turbine, and made great advancements to the control systems by adding distributed control.  At Nuclear Power Asia in Vietnam this past month, a presentation by Mitsubishi showed how they improved their construction schedule from 77 months to 50.5 months from the Ohi 1 project to Ohi 3.   Westinghouse is learning lessons from its experience in China and is applying them to their AP1000 projects in the US using advanced modular construction technology. And here at home in Canada where Bruce Power, whose tag line is “Innovation at work”, has found ways to increase the life of its reactors well beyond what was thought possible only a few years ago.

The analogy can be made to cars.  The cars we drive today are very similar to those we drove 30, 40 and even 50 years ago.  Four wheels, combustion engine, rubber tires.  But are they really?  In fact almost nothing is the same.  Our cars today are full of electronics controlling the engine; the bodies no longer rust away in a few short years, safety has been greatly improved through air bags and other enhancements; and tires rarely go flat so that many models no longer carry spares.  In fact technology has advanced in leaps and bounds in the cars we drive every day.  And even though we are now looking at next generation technology such as electric and hydrogen powered cars, these are still novelties.  These types of advancements are not required to innovate our vehicles.  In fact the opposite is true.  It is the innovation in the everyday systems in our cars that continue to make them better.  And the magnitude of these improvements is staggering.

Somehow this message is not getting through with our nuclear plants.  It may be because we operate in a very rigorous regulatory environment that forces nuclear utilities to be extremely conservative as change creates risk.  Add to that the magnitude of the capital investment in a nuclear plant and the conservatism increases further as the risk of an advancement is always taken into consideration when looking to the future.

That being said, the operators of today’s fleet of nuclear plants have made incredible improvements to the operating fleet.  This is why capacity factors (percent of maximum possible production) today can be 90% +.  Back in the 1980s, a capacity factor in the mid 80% range was considered excellent.  But no more.  Today we expect better performance from our plants and we get it-through everyday innovation!

US-Nuclear-Capacity-Factor0011

Source: www.nei.org

When it comes to operations, the improvements are easy to show through improved performance of the operating fleet.  The issue we have had in the west is an insufficient number of new build projects to show the innovation that is happening every day in this industry when it comes to new projects.  New build in western countries have had a rocky start after decades of not building.  But as we move forward, this too will improve.

For new projects, we need to not only be building to budget and schedule, but also showing that costs and schedules are reducing with time.  The Koreans, Chinese and Japanese have clearly demonstrated the benefits of standardized fleets to reduce costs and schedules as they build more and more plants.  We see them innovating as they learn from each project and move on to the next one.  We are already seeing improvement in the US as the Summer plant is taking advantage of lessons learned from the Vogtle plant; and both are benefiting from the experience in China.

We must be able to demonstrate that today’s nuclear technology is a technology of the future and that advancements are indeed coming that make every project better than the last.  If an agency looking to the future of energy thinks there is no innovation in nuclear, then we need to be more vocal about our achievements.  We need to celebrate our innovation.  And we need to continue to invest in further innovation because there is always room to get better.

Our strength is through our performance.  And our performance continues to get better through innovation, each and every day.  For those of you who have good examples of where innovation has benefited the industry, please post them as a comment.

Authored by:

Milton Caplan

Milt has more than 30 years experience in the nuclear industry advising utilities, governments and companies on new build nuclear projects and investments in uranium.

He specializes in advising governments and utilities on how to increase confidence and reduce risk for new nuclear projects with a focus on managing nuclear projects for success.  This includes such areas as cost of nuclear ...

See complete profile

Read More
Powered By Blogger · Designed By Alternative Energy